発表場所 : 食品照射, 40巻, pp.19-24
著者名 : 坂部 寛 1)、斉藤希巳江 2)、等々力節子2)
著者所属機関名 :
1)独立行政法人農林水産消費技術センター横浜センター(〒231-0003 横浜市中区北仲通5-57)
2)独立行政法人食品総合研究所(〒305-8642 茨城県つくば市観音台2-1-12)
発行年月日 : 2005 年 9 月 30 日
Fig. 1 TL glow curves of minerals from white pepper irradiated with (a,
a’) γ-rays and
(b, b’) X-rays at 1.0 kGy. The measurements were made after 3 days of storage
since radiation treatment.
Fig. 2 TL glow curves of minerals from potato irradiated
with (a)γ-rays and (b) X-rays at 1.0 kGy.
Fig. 3 TL glow curves of quartz sand irradiated with
(a)γ-rays and (b) X-rays at 1.0 kGy.
Fig. 4 TL glow curves of minerals from potato.
glow 1: irradiation with γ-rays at 5 kGy.
(before re-irradiation)
glow 2 (γ-ray): re-irradiation with γ-rays at 1 kGy.
glow 2 (X-ray): re-irradiation with X-rays at 0.5 kGy.
After re-irradiation, samples were stored overnight.
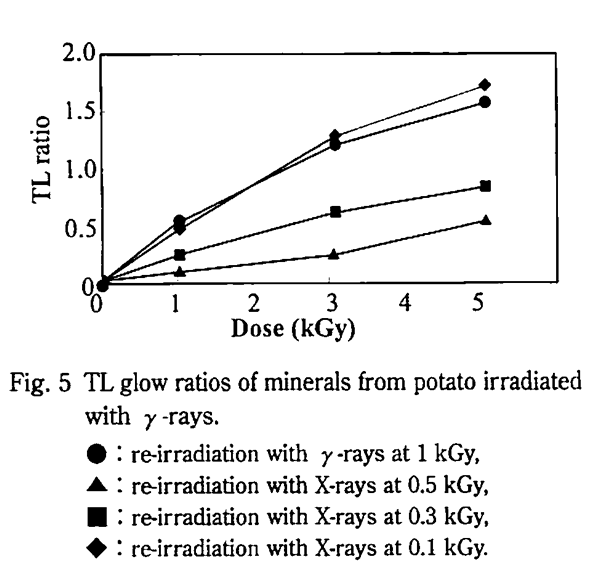
Fig. 5 TL glow ratios of minerals from potato irradiated
with γ-rays.
●:re-irradiation with γ-rays at 1 kGy,
▲:re-irradiation with X-rays at 0.5 kGy,
■:re-irradiation with X-rays at 0.3 kGy,
◆:re-irradiation with X-rays at 0.1 kGy.
関係する論文一覧に戻る
ホームに戻る